Marketplace
One platform for every industrial move.
Find industrial products, hire experts, access manufacturing capabilities, and bring your projects to life—from a new device to a new or upgraded factory.
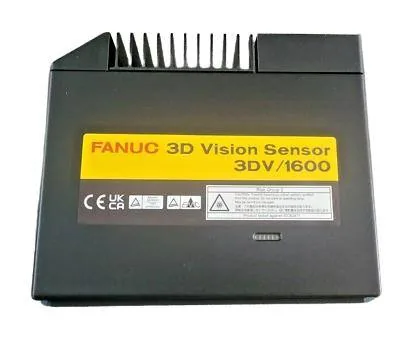
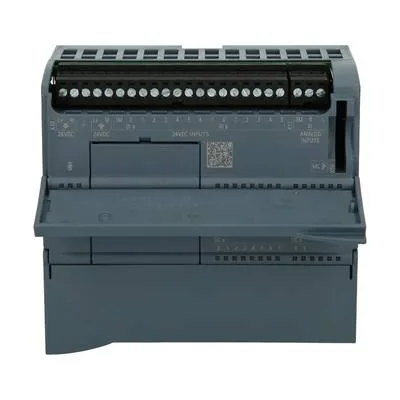
Industrial Services
Hire experts and access execution capabilities
Expert ServiceDemo offerReview a PLC programPLC Program Review · technical review report · S7-1200 / S7-1500 · RemoteOryx Automation · Industrial ExpertOrder this service
Manufacturing CapabilityDemo offerHave parts made from your drawingCNC machining · material and quantity required · STEP / IGES · On-site, QatarTigris Line Engineering · Manufacturing PartnerRequest a manufacturing quote
Industrial Projects
Explore a path from industrial goal to execution
Project ExampleDevelop a deviceCoordinate several activities toward a new device.DesignPrototypeManufacture
Project ExampleAutomate a production lineOrganize a coordinated line upgrade.RequirementsIntegrationCommissioning
Structuring a project with INDUNV AI Assistant requires an active paid subscription.
INDUNV AI Assistant
INDUNV AI Assistant helps clarify your requirements, explore relevant options, and plan your next step.
Available with an active paid subscription.
IllustrationGoalRequirementsRelevant optionsNext step
Factory Assessment
Understand your factory's current situation and identify areas to improve
Factory readiness assessment guide
Learn what factory readiness assessment covers, what it can reveal, and how it can support your next improvement steps.
Offer your industrial expertise or manufacturing capabilities.
Help customers find your services, technical team, or manufacturing capacity.
Real identities, labelled demos
Every preview is a real public record or a clearly labelled example — no invented providers, prices or ratings.
Clear scope and next steps
Listings state scope, deliverables and inputs; the action on each card is the one the listing supports.
Help and support
Questions about a listing or the platform: info@indunv.com
Subscription options
INDUNV AI Assistant is available to signed-in users with an active paid subscription. Registration alone does not unlock it — ordinary search, filters and all public listings work without a subscription.
Pricing is not established yet — no plan, price or trial is offered on this pageWhat the assistant does for eligible subscribers
- Clarifies a requirement and suggests relevant filters and listings.
- Identifies missing inputs and proposes work packages for a project.
- Summarises actual proposals and surfaces open decisions.
It never manufactures credentials, selects a supplier, approves a price, transmits a confidential file or accepts a delivery. Every draft stays editable — the human reviews and sends.
| Your state | What you see | What happens |
|---|---|---|
| Guest | View subscription options | This page — sign in or create an account first; no AI session opens. |
| Signed in, no active paid subscription | View subscription options | This page — subscription activation is not available yet; you will be informed when pricing is decided. |
| Signed in, active paid subscription | Open INDUNV AI Assistant | The assistant opens after eligibility is verified. |
| Signed in, expired subscription | Renew subscription | Renewal offered; no new paid AI actions run. |
| Status unavailable | Try again | Eligibility could not be checked — the account is not called unpaid. |
Draft retention and the treatment of expired subscriptions beyond new AI use need a separate policy (open decision O07).
Technical serviceManufacturing CapabilityIndustrial ExpertCompany & Technical TeamManufacturing PartnerDemo ProfileDemo offer
MES Integration Scope
Demo listing for prototype demonstration only. Not a real commercial offer.
Scope
Scoping of an MES integration for one production area: requirements mapping, interface plan (OPC-UA / REST API), traceability data model and a commissioning scope the client can put out for quotation.
Exclusions
- Software licences, MES configuration and go-live support (quoted separately after clarification)
- Changes to PLC programs or machine controls
- Network hardware and IT infrastructure
Deliverables
- Requirements map with priorities and open questions
- Interface plan (OPC-UA · REST API) with data-point list
- Commissioning scope with acceptance tests and responsibilities
Acceptance criteria
- Every requirement traces to a machine, system or role named by the client
- Interface plan lists each data point with source, frequency and owner
- Commissioning scope reviewed with the client in one walkthrough
Required inputs
- Machine list with controller types and existing connectivity
- Current production, quality and planning workflows
- Existing systems in use (ERP, planning, quality)
Prerequisites
- A client contact for production and one for IT
- Site visit or remote access agreed for the current-state review
Options — packages with genuinely different deliverables
Remote scoping
Requirements map and interface plan from remote workshops.
Base scopeScoping + site assessment
Adds an on-site current-state assessment of machines and networks.
Scope + duration changeScoping + pilot interface
Adds one pilot machine interface as proof of the plan.
Scope + inputs + price changeDuration
Quotation after clarification — typically 2 to 4 weeks for one production area (demo value)
Commercial terms
Quotation after clarification. Pricing depends on the number of machines and systems; the proposal states scope, exclusions, assumptions, validity and a cost breakdown.
Included revisions
One revision of the interface plan after the client's review. Additional production areas are a separate scope.
Confidentiality & file use
Workflow documents and machine data are used only for this scoping and shared with the named team. NDA on request.
Provider evidence
Self-declaredEvidence submittedEvidence reviewedVerified claim
This demo profile carries self-declared capabilities only. Identity verification does not verify every technical skill; verified claims name what was checked, within what scope and when.
Discover how ready your factory is for industrial transformation.
Discover where you stand, what needs to improve, and what to do next.
Assess your factory across technology, processes, and organization. Identify strengths and gaps, then use the findings to set improvement priorities and explore suitable technologies and industrial services.
This guide is open to everyone without signing in. Using the assessment tool requires sign-in.
Three pillars · Eight capabilities · Advisory guidance
What is a factory readiness assessment?
The industrial transformation journey begins with understanding your factory’s readiness.
A readiness assessment is a structured way to understand how prepared a factory is to develop its capabilities and adopt more advanced technologies and ways of working. It considers systems, processes, data, people, and management together.
Your answers and available evidence help describe the current state, strengths, and gaps. The aim is to identify practical development steps, not simply to produce a number or compare factories without context.
Readiness
How prepared the factory is to adopt change and benefit from it.
Maturity
How developed the factory’s existing practices and capabilities are.
Who is this guide for?
Factory owners and managers, engineers and operations teams, technology and service providers, and anyone interested in industrial transformation. You can learn from this guide even if you do not run a factory or plan to take an assessment now.
How can assessment help?
Understand the current situation
Build a structured picture of current practices and capabilities rather than relying on a general impression.
Recognize strengths and gaps
Distinguish what you can build on from what needs further information or development.
Clarify improvement priorities
Consider the findings alongside the factory’s objectives and circumstances to identify areas worth examining first.
Connect a need to a next step
Turn a defined need into requirements for technology, a service, or a project, according to the factory’s context and available platform functions.
The usefulness of findings depends on answer completeness and the quality of information and evidence. Assessment supports decisions; it does not guarantee performance or returns.
What does the assessment cover?
Technology
Connectivity, data and intelligence, and automation.
Processes
Process integration, quality management, and maintenance maturity.
Organization
Workforce readiness, strategy, and governance.
- Shop-floor connectivityConnect machines and systems and protect operational data flows.
- Data and intelligenceTurn reliable operational data into usable insights and repeatable decisions.
- AutomationReduce manual intervention where appropriate while preserving flexibility and safety.
- Process integrationConnect planning, operations, and production in a more coherent workflow.
- Quality managementDetect defects, understand their causes, and improve prevention.
- Maintenance maturityDevelop maintenance practices with increasing use of equipment condition and data.
- Workforce readinessUnderstand the skills, knowledge, and adoption support needed for change.
- Strategy and governanceAlign transformation with objectives, responsibilities, decisions, and measurable outcomes.
How do you take the assessment?
Read the guide here, then move to the assessment tool when you are ready.
- Sign-inUse your account, or create one through the registration options available on the platform.
- Identify the factory and its contextProvide the required factory information and identify the operational challenges you want to understand.
- Assess the capabilitiesAnswer according to current conditions. Use “Unknown” or skip a question where allowed, and add evidence when available.
- Review outputs and next stepsReview the outputs available for the capabilities you have completed, then consider improvement areas and suitable options.
Hypothetical educational example — not an assessment result
Example: from an operational challenge to an improvement step
A factory wants to understand recurring stoppages on one production line.
The challenge
Recurring stoppages and incomplete information about failures and maintenance work.
What would be reviewed?
Downtime records, maintenance practices, data collection, and the relevant skills and responsibilities.
What need might emerge?
The first step may be better failure recording and maintenance organization. Maintenance-management systems or condition monitoring may merit investigation later if their suitability is established.
How could platform sections help?
Explore a relevant technology category, define an integration or training service, and prepare a pilot-project draft for review, where these functions are available.
How would the effect be reviewed?
Define a baseline and a suitable indicator, such as downtime, then compare actual measurements over comparable periods. Do not assume an improvement in advance.
This example only illustrates an approach. It does not concern a real factory and contains no score, automated recommendation, or promised outcome.
How can your results support the rest of INDUNV?
Use the findings to clarify what you need, then choose the relevant next step. Connections depend on feature availability and the information you approve for sharing.
Industrial marketplace
Turn a documented need into relevant technology, equipment, or system categories. Explore options and proceed to a quotation or purchase where supported.
Industrial services
Define the expertise and delivery support your factory needs, from integration and engineering to training or manufacturing support.
Industrial projects
Develop a selected improvement opportunity into a project draft with a scope, milestones, baseline, targets, and acceptance evidence.
INDUNV Passport
Retain a dated assessment record, evidence references, and improvement decisions to support future comparisons when passport integration is available.
INDUNV AI Assistant
Ask for explanations, understand the basis of a recommendation, and explore next steps using the assessment context you choose to provide.
You can browse technologies and services without completing an assessment. The assessment adds context when you need it.
From readiness assessment to measurable transformation
- Factory Readiness Assessment
- Diagnosis
- Prioritization
- Planning
- Solution matching
- Purchasing and contracting
- Implementation
- Measurement and improvement
These stages explain the wider transformation journey. They are not mandatory browsing steps or evidence that every integration is active. Each function must show its actual availability.
What is useful to prepare?
General knowledge of the factory and its operations, the main challenges, and any available operations, maintenance, or quality records. Record missing information honestly; no file upload is needed to read this guide.
How does INDUNV assess readiness?
INDUNV-FRA is INDUNV’s advisory assessment model. It uses answers and available evidence across technology, processes, and organization to describe the current state and support development decisions.
This guide describes the assessment’s scope and purpose. Questions, data entry, and private results remain in the assessment tool after sign-in.
Advisory assessment — not certification
This assessment helps explain the factory’s current state and possible next steps. It is not an accredited audit and does not issue an official certificate or accreditation.
This page uses general explanations and examples, not answers, files, or results from real factories. Sharing information from your assessment with another party requires appropriate permissions and review.
Frequently asked questions
Do I need an account to read this page?
No. The guide, examples, and FAQs are available without an account. Sign-in is required to start or continue an assessment.
How long does assessment take?
It depends on the capabilities assessed, question depth, and available information and evidence. No fixed duration is stated without measurement of the actual user experience.
Do I need to be an Industry 4.0 expert?
You do not need specialist terminology to get started. This guide explains the basic concepts. During assessment, use information you actually know and consult knowledgeable people in the factory when needed.
What if some information is unavailable?
Do not guess. Select “Unknown” or skip a question where allowed. Missing information may limit the outputs and their accuracy; it does not mean the value is zero.
Will I receive a certificate or accreditation?
No. INDUNV-FRA is INDUNV’s own advisory model for understanding readiness and supporting improvement decisions, not an accredited audit or official certification.
Does registering make every function free?
No. Signing in and subscription-based feature access are different. Plan and feature details are shown in the relevant platform sections; reading this guide requires no payment.
Is assessment required to buy technology or request services?
Assessment is not a general prerequisite for exploring, purchasing, or requesting services. It is an optional path that helps clarify a need. Each function’s own account and access requirements still apply.
Is this useful if I do not own a factory?
Yes. Engineers, service providers, students, and others interested in industry can learn about readiness concepts and factory needs.
Ready to understand your factory’s readiness?
Move to the assessment tool, or continue exploring the technologies and services that interest you.
Using the assessment tool requires sign-in. Reading this guide does not require an account.